Historically, a good way for a government to generate a financial crisis is to run large budget deficits while escalating the money supply. Emerging market countries have executed this playbook countless times with predictable results: debt defaults, inflation, a weaker currency. Do the same rules apply to developed economies? Perhaps not. Modern Monetary Theory (MMT) suggests that countries which spend, tax and borrow in a currency they control do not actually have constraints on government spending, because new money can always be created to cover any differences between government revenue and spending. Whether you embrace MMT as a way for governments to better serve their people or believe it is irresponsible folly, government policies in the developed world have been moving in that direction. The outcome of this shift in economic policy will have important implications for investment markets.
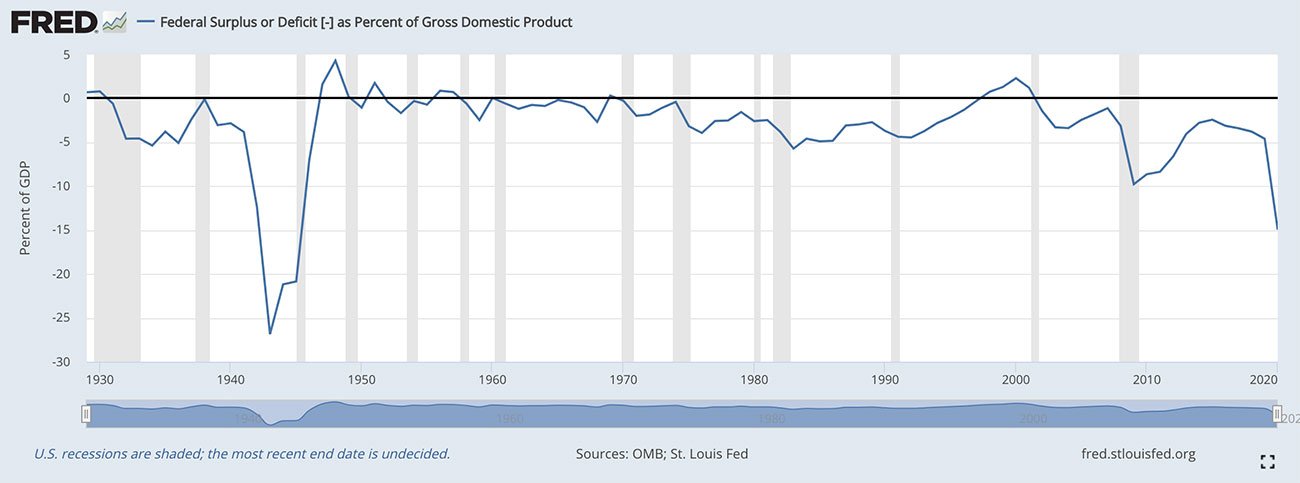
Real GDP in the US was expected to rise more than 3% in 2020 and instead fell over 3% due to the economic impact of the COVID pandemic. The response of the US government so far has been much larger than the economic decline, a series of relief packages already totaling more than $5 trillion (23% of US GDP). Next up is a $2.2 trillion infrastructure package, another 10% of US GDP (spread over multiple years). The Congressional Budget Office estimates that the 2021 US budget deficit will be 10.3% of GDP, which would be the second largest since World War II, exceeded only by the deficit of 14.9% of GDP in 2020[1].
[1] Source, CBO: https://www.cbo.gov/publication/56996#:~:text=February%2011%2C%202021.-,Deficits,percent%20shortfall%20recorded%20last%20year.
As intended, all this spending has stimulated economic growth and markets. US real GDP is expected to grow 6.2% in 2021, the highest since 1984. As we noted in previous commentaries, valuation metrics for the S&P 500 have become quite lofty by historical standards. At 33.5, the price to earnings ratio of the S&P 500 is the highest ever, higher even than the peak reached at the height of the technology stock bubble.
What comes next? Last year’s recession led to the largest year-over-year US GDP decline in 75 years. Consider the prior big recession of 1945. Once World War II ended, the US government moved rapidly from a deficit of over 20% of GDP in 1945 to a small budget surplus in 1947. The recession brought about by this huge reduction in federal spending was a monster, an abrupt 12.7% drop in US economic activity. Today, US political leaders of both parties seem much less inclined to seek balancing the books. But, as governments (and teenagers) throughout history have learned, carrying on as if there are no constraints is a great way to find out what the actual constraints are.
In 2020, even as the global economy was still heavily impacted by the COVID pandemic, stock prices began to rise strongly. Investors looked beyond the current troubles, accurately anticipating that stimulus spending and health remedies would lead to a strong economic recovery. Equity investors may not be as prescient today. With the gusher of stimulus spending still underway, equity investors appear to be caught up in the moment, not anticipating the consequences of government spending falling back to more normal levels.
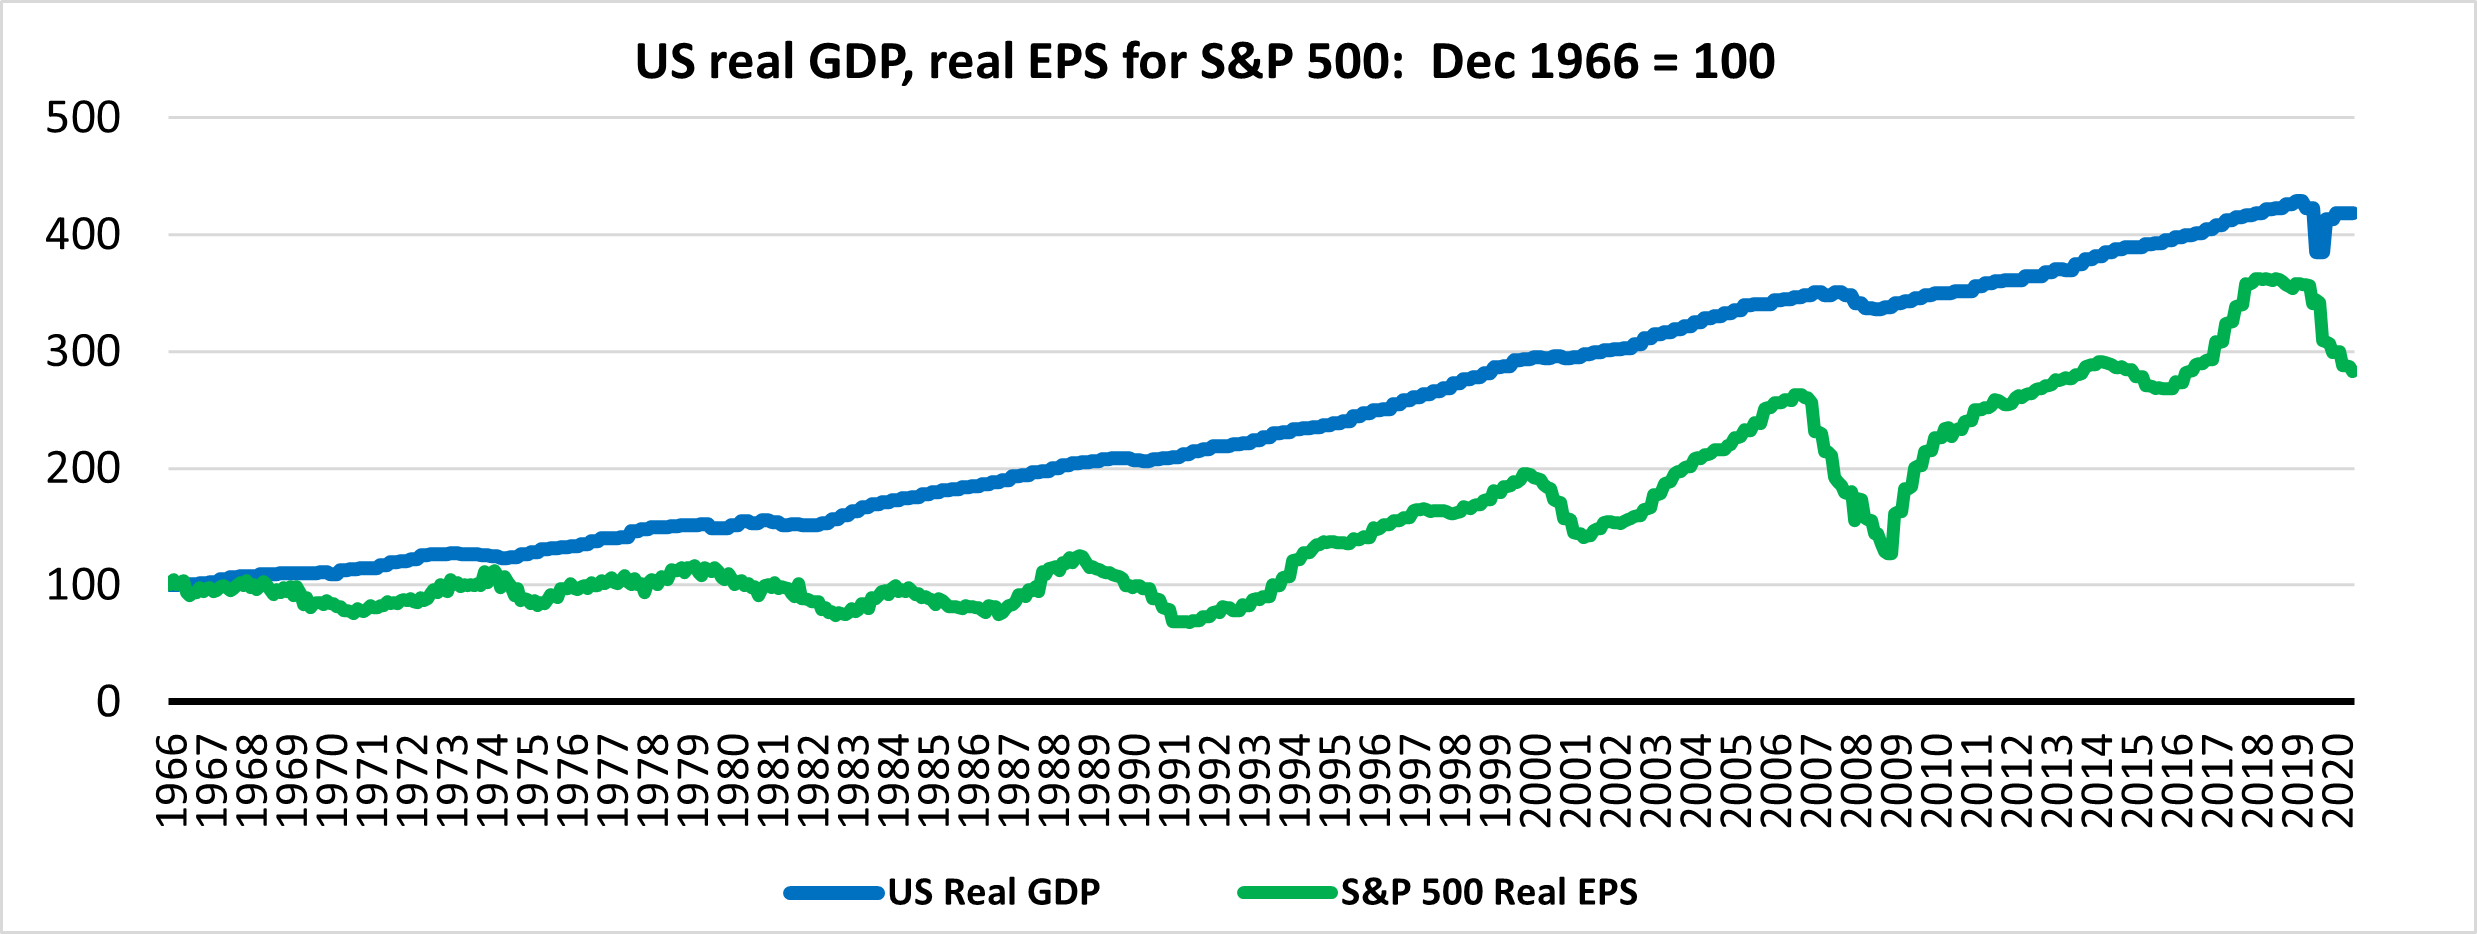
We can see the euphoria in the projections for earnings per share of the S&P 500. The chart below shows US real GDP and S&P 500 real EPS since 1966. US GDP growth has been an upper boundary for earnings growth. However, if we can believe earnings projections, that boundary will be soon overcome. Projected S&P 500 EPS in 2022 is $200.40 per share, 25% more real EPS than was achieved in 2019. At the same time, projected US real GDP in 2022 is expected to be just 6% more than in 2019. On the chart below, the blue and green lines would cross at 450 by 2022, which seems unlikely.
Historically, US budget deficits of the current scale have only occurred in wartime and led to much higher inflation than currently anticipated by investors. In 1940 to 1947, US consumer prices rose by nearly 8% per year. We examined the historical relationship of US CPI to subsequent real (vs. inflation) annual returns of 10-year US Treasury bonds and the S&P 500[2]. At each point we classify CPI as “high” or “low” relative to the prior 20-year average and “rising” or “falling” relative to the year before. The most harmful scenario for both stock and bond investors has been “high and rising.” In that condition, bonds returned 2.9% less than inflation and stocks returned 3.3% less than inflation. With US CPI at 2.6% as of March 2021 we have reached “high and rising”, since the 20-year average was 2.0% and CPI one year ago was 1.5%.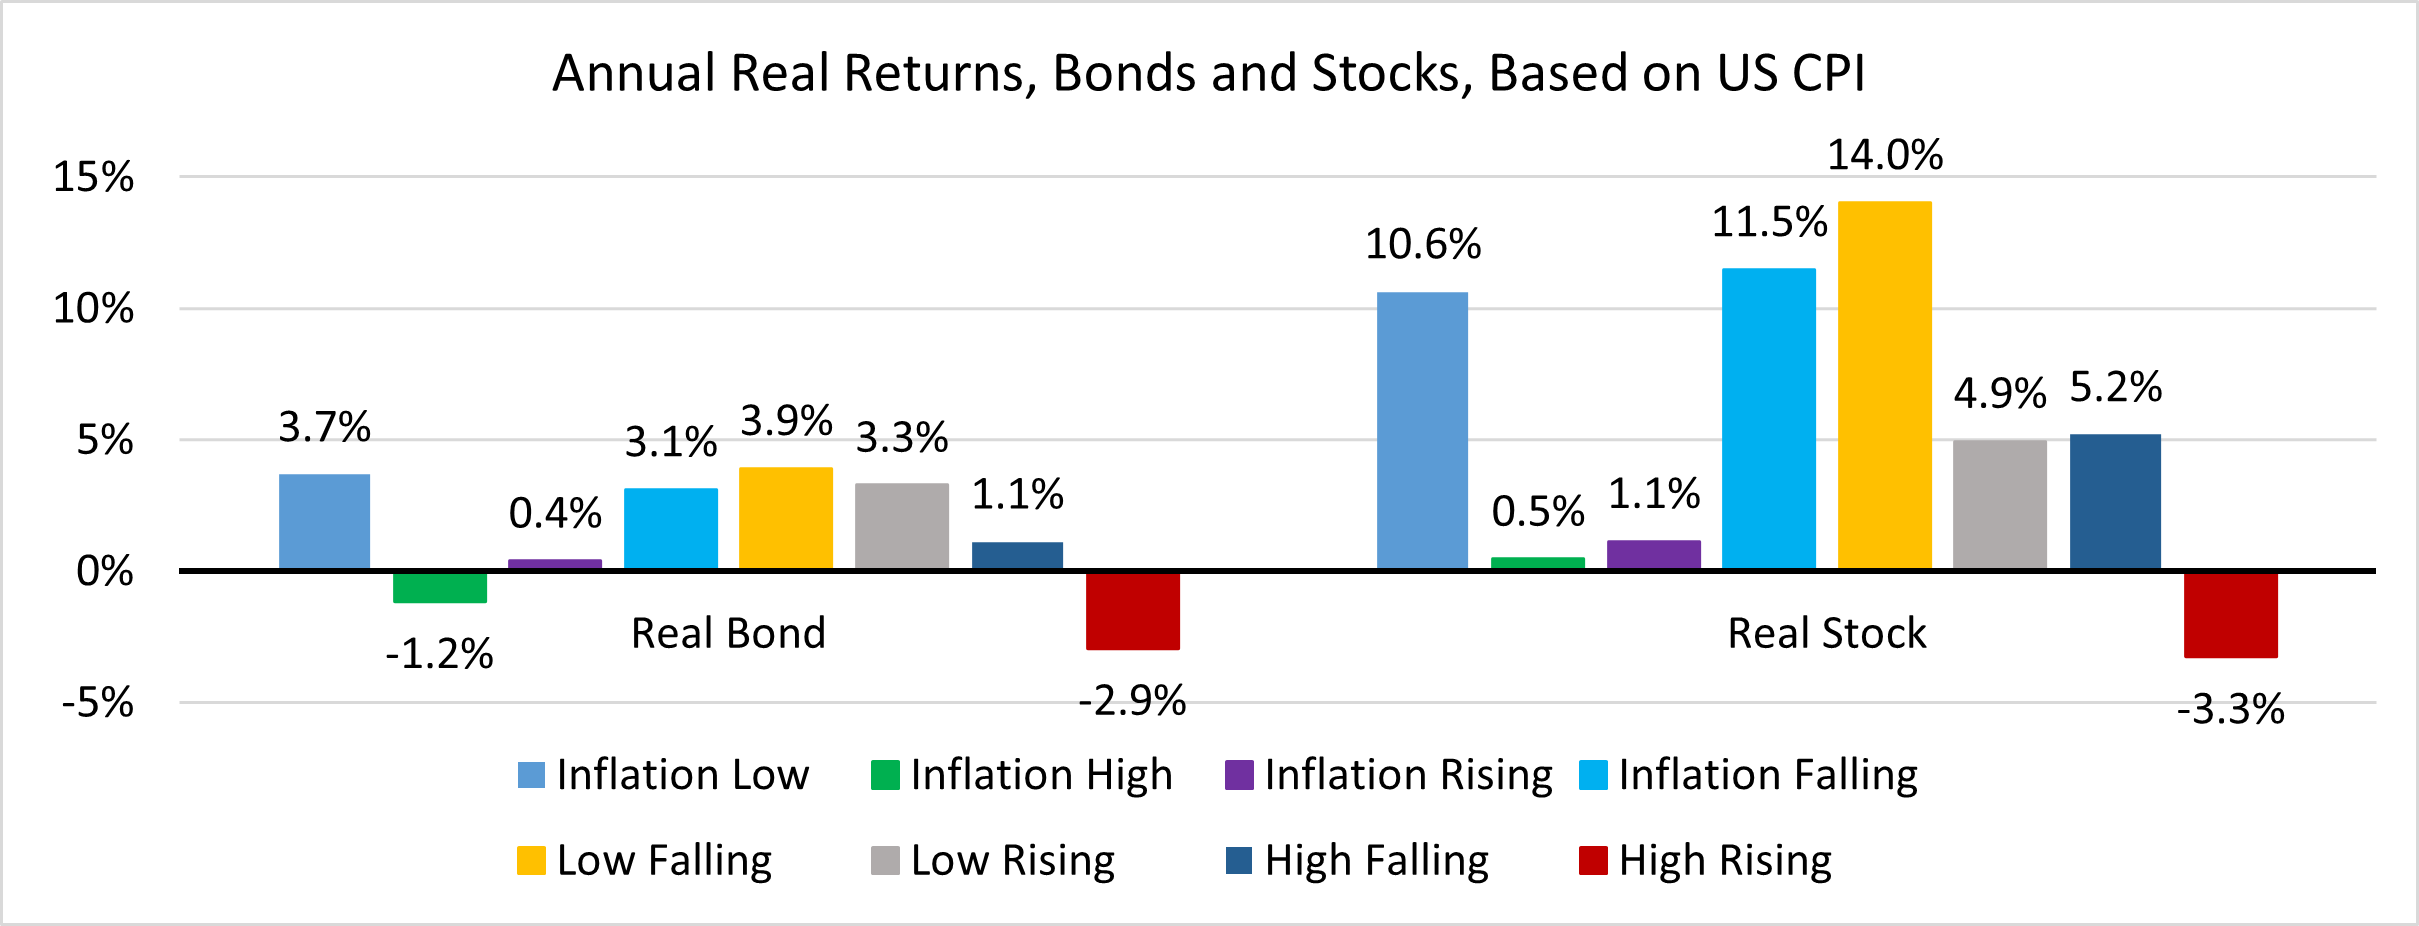
[2] Shiller Dataset http://www.econ.yale.edu/~shiller/data.htm, S&P 500 real total return, 10y US treasury real return, data since 1945
Economic policymakers, including Fed Chair Powell and Treasury Secretary Yellen, argue that “this time is different,” that expansive fiscal and monetary policy is needed and can continue with no ill effect. The consensus (and market prices) currently align with that mainstream view. The market price for expected inflation over the next ten years is only 2.5%. The US 10-year Treasury note yield is just 1.6%, which would not be a sensible yield to accept if investors expected inflation to surge higher. Of course, the 1.6% is artificially low, heavily influenced by the ongoing purchases of US Treasury securities by the Federal Reserve.
We have been around long enough and have studied enough financial history to have a well-developed skepticism regarding any “this time is different” argument. More often than not, the same inputs lead to the same outputs. While we can’t say with certainty that inflation is going to become a problem, it is high on the list of the concerns we are monitoring for our clients.


Historically, a good way for a government to generate a financial crisis is to run large budget deficits while escalating the money supply. Emerging market countries have executed this playbook countless times with predictable results: debt defaults, inflation, a weaker currency. Do the same rules apply to developed economies? Perhaps not. Modern Monetary Theory (MMT) suggests that countries which spend, tax and borrow in a currency they control do not actually have constraints on government spending, because new money can always be created to cover any differences between government revenue and spending. Whether you embrace MMT as a way for governments to better serve their people or believe it is irresponsible folly, government policies in the developed world have been moving in that direction. The outcome of this shift in economic policy will have important implications for investment markets.
Real GDP in the US was expected to rise more than 3% in 2020 and instead fell over 3% due to the economic impact of the COVID pandemic. The response of the US government so far has been much larger than the economic decline, a series of relief packages already totaling more than $5 trillion (23% of US GDP). Next up is a $2.2 trillion infrastructure package, another 10% of US GDP (spread over multiple years). The Congressional Budget Office estimates that the 2021 US budget deficit will be 10.3% of GDP, which would be the second largest since World War II, exceeded only by the deficit of 14.9% of GDP in 2020[1].
[1] Source, CBO: https://www.cbo.gov/publication/56996#:~:text=February%2011%2C%202021.-,Deficits,percent%20shortfall%20recorded%20last%20year.
As intended, all this spending has stimulated economic growth and markets. US real GDP is expected to grow 6.2% in 2021, the highest since 1984. As we noted in previous commentaries, valuation metrics for the S&P 500 have become quite lofty by historical standards. At 33.5, the price to earnings ratio of the S&P 500 is the highest ever, higher even than the peak reached at the height of the technology stock bubble.
What comes next? Last year’s recession led to the largest year-over-year US GDP decline in 75 years. Consider the prior big recession of 1945. Once World War II ended, the US government moved rapidly from a deficit of over 20% of GDP in 1945 to a small budget surplus in 1947. The recession brought about by this huge reduction in federal spending was a monster, an abrupt 12.7% drop in US economic activity. Today, US political leaders of both parties seem much less inclined to seek balancing the books. But, as governments (and teenagers) throughout history have learned, carrying on as if there are no constraints is a great way to find out what the actual constraints are.
In 2020, even as the global economy was still heavily impacted by the COVID pandemic, stock prices began to rise strongly. Investors looked beyond the current troubles, accurately anticipating that stimulus spending and health remedies would lead to a strong economic recovery. Equity investors may not be as prescient today. With the gusher of stimulus spending still underway, equity investors appear to be caught up in the moment, not anticipating the consequences of government spending falling back to more normal levels.
We can see the euphoria in the projections for earnings per share of the S&P 500. The chart below shows US real GDP and S&P 500 real EPS since 1966. US GDP growth has been an upper boundary for earnings growth. However, if we can believe earnings projections, that boundary will be soon overcome. Projected S&P 500 EPS in 2022 is $200.40 per share, 25% more real EPS than was achieved in 2019. At the same time, projected US real GDP in 2022 is expected to be just 6% more than in 2019. On the chart below, the blue and green lines would cross at 450 by 2022, which seems unlikely.
Historically, US budget deficits of the current scale have only occurred in wartime and led to much higher inflation than currently anticipated by investors. In 1940 to 1947, US consumer prices rose by nearly 8% per year. We examined the historical relationship of US CPI to subsequent real (vs. inflation) annual returns of 10-year US Treasury bonds and the S&P 500[2]. At each point we classify CPI as “high” or “low” relative to the prior 20-year average and “rising” or “falling” relative to the year before. The most harmful scenario for both stock and bond investors has been “high and rising.” In that condition, bonds returned 2.9% less than inflation and stocks returned 3.3% less than inflation. With US CPI at 2.6% as of March 2021 we have reached “high and rising”, since the 20-year average was 2.0% and CPI one year ago was 1.5%.
[2] Shiller Dataset http://www.econ.yale.edu/~shiller/data.htm, S&P 500 real total return, 10y US treasury real return, data since 1945
Economic policymakers, including Fed Chair Powell and Treasury Secretary Yellen, argue that “this time is different,” that expansive fiscal and monetary policy is needed and can continue with no ill effect. The consensus (and market prices) currently align with that mainstream view. The market price for expected inflation over the next ten years is only 2.5%. The US 10-year Treasury note yield is just 1.6%, which would not be a sensible yield to accept if investors expected inflation to surge higher. Of course, the 1.6% is artificially low, heavily influenced by the ongoing purchases of US Treasury securities by the Federal Reserve.
We have been around long enough and have studied enough financial history to have a well-developed skepticism regarding any “this time is different” argument. More often than not, the same inputs lead to the same outputs. While we can’t say with certainty that inflation is going to become a problem, it is high on the list of the concerns we are monitoring for our clients.
Subscribe To Receive The Latest News
Related Posts
March 2024 Recap
Europe or the Big Six?
Have Alternative Investments Helped Investment Outcomes?
February 2024 Recap