


In 1992-1993, Eugene Fama and Kenneth French published several academic papers that provided investing ideas that expanded on the classic Capital Asset Pricing Model (CAPM). They showed that over long periods, 90% of returns from diversified portfolios could be explained by 1) beta (the overall stock market return, adjusted for correlation and volatility), 2) valuation, and 3) size.
We recognize that no model is infallible and believe that human behavior is impossible to quantify. However, the Fama-French findings are instrumental variables for screening potential investment candidates to include in a diversified portfolio. Below are some of the value factors we consider in our investment decision framework.
Price-to-Earnings (P/E) ratio: The P/E ratio is the ratio of a company’s stock market price to its net earnings per share. The P/E ratio is a widely known concept, but we prefer the inverse ratio, the E/P ratio or earnings yield, for comparative analysis to bonds, REITs, preferreds, and various arbitrage strategies. Again, typical growth companies are relatively nascent in existence and probably have nominal or no earnings, resulting in high P/E ratios. A company with a P/E ratio of 50 (earnings yield of 2%) will have to grow its earnings much faster than a company with a P/E ratio of 10 (earnings yield of 10%) to justify its lofty P/E.
Price-to-Cash Flow (P/CF) ratio: The P/CF ratio is the ratio of a company’s market value to its operating cash flow per share. Operating cash flow (OCF), as the name implies, is the cash a company earns from its normal business operations. One standard definition: OCF = EBIT (Earnings Before Interest & Taxes) + Depreciation – Taxes. OCF is a good measure of the strength of a company. In theory, companies with a lower P/CF will tend to perform better than those with a higher P/CF as the market ultimately will recognize the company’s underlying strength. We prefer to invest in companies with consistent cash flow and solid cash flow margins. Growth companies frequently are relatively young and unestablished. As a result, they may have little to no stable operating cash flow and correspondingly exhibit high P/CF multiples.
Price-to-Book (P/B) ratio: This is the ratio of a company’s market value relative to its GAAP book value. Book value is found on a company’s balance sheet and represents the total value of a company’s assets minus the value of its debt and other liabilities. We focus on this metric when analyzing the value of a company. We prefer to invest in companies with low price-to-book ratios.
As an example of the potential benefit of Value investing, the chart shows the cumulative difference in return between the MSCI ACWI enhanced value index and the MSCI ACWI (capitalization-weighted) index. Similar to Atlas Capital, MSCI enhanced value indices utilize price to earnings, enterprise value to cash flow, and price to book. Investors in the value index would have earned more than double the total return of the capitalization-weighted index in the period from December 1998 to June 2021. However, this benefit combines solid relative returns for Value stocks through 2010 and steady underperformance by Value stocks since then.
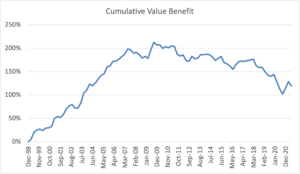
Source: Bloomberg, M1WDOV Index for ACWI (All-Country World Index, an index of global equities) enhanced value and NDUEACWF for ACWI cap-weighted. The ratio of the cumulative return of ACWI value to the cumulative return of ACWI capitalization-weighted.